Far Sync (Oracle 12c New Feature)


Oracle Far Sync is an Oracle 12c new feature for Oracle Data Guard. This feature is meant to resolve the performance problems induced by network latency when you maintain a standby database geographically distant of the primary database. In this type of situation you sometimes have to make a compromise between performance and data loss. The Far Sync feature offer you both.

How does Far Sync works ?

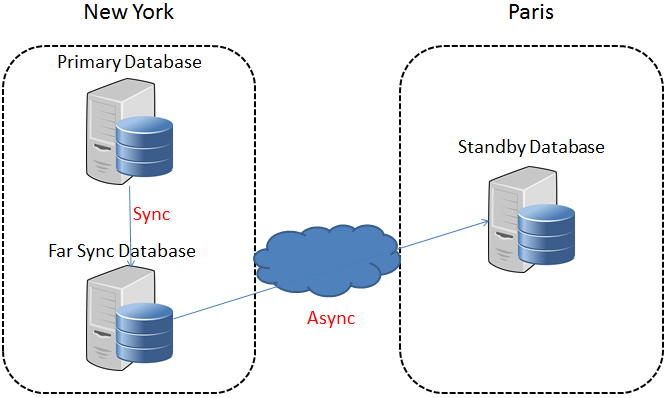
The principe is fairly simple, the Far Sync instance receive data synchronously from the primary database and then forward it asynchronously to up de 29 remote destinations.

Data Guard Far Sync
Continue reading Far Sync (Oracle 12c New Feature)

Average Active Sessions (AAS)

The Average Active Sessions (AAS) metric is a very good indicator of the database activity.
This metric represents the number of sessions, either working or waiting for a resource at a specific point in time.
Idle sessions are not included in the calculation of this metric.
To calculate AAS, we need another metric called “DB Time” which represents the total time spent in the database by sessions, either working or waiting (The real work done in the database).
This DB time is divided by the clock elapsed time to obtain the Average Active Sessions.
The following script will calculate the Average Active Sessions from v$active_session_history view.

Be careful, this view is part of the diagnostic pack, you should not query this view if you don’t have license for it.

Average Active Sessions from v$active_session_history

select round((count(ash.sample_id) / ((CAST(end_time.sample_time AS DATE) - CAST(start_time.sample_time AS DATE))*24*60*60)),2) as AAS
from
	(select min(sample_time) sample_time 
	from  v$active_session_history ash 
	) start_time,
	(select max(sample_time) sample_time
	from  v$active_session_history 
	) end_time,
	v$active_session_history ash
where ash.sample_time between start_time.sample_time and end_time.sample_time
group by end_time.sample_time,start_time.sample_time;

You can restrict period of time analyzed by filtering with the sample_time column. Here is AAS from the last hour :

select round((count(ash.sample_id) / ((CAST(end_time.sample_time AS DATE) - CAST(start_time.sample_time AS DATE))*24*60*60)),2) as AAS
from
	(select min(sample_time) sample_time 
	from  v$active_session_history ash 
	where sample_time between sysdate-1/24 and sysdate) start_time,
	(select max(sample_time) sample_time
	from  v$active_session_history 
	where sample_time between sysdate-1/24 and sysdate) end_time,
	v$active_session_history ash
where ash.sample_time between start_time.sample_time and end_time.sample_time
group by end_time.sample_time,start_time.sample_time;

This metric can be correlated with the Graph from v$active_session_history

Top 10 sessions from v$active_session_history

Description

This query returns the top 10 sessions from v$active_session_history. The result is ordered by total resources consumed by the session including I/O, WAITS and CPU
Be careful, this view is part of the diagnostic pack, you should not query this view if you don’t have license for it.

top 10 sessions from v$active_session_history

select * from (
select
     session_id,
	 session_serial#,
     program,
	 module,
	 action,
     sum(decode(session_state,'WAITING',0,1)) "CPU",
     sum(decode(session_state,'WAITING',1,0)) - sum(decode(session_state,'WAITING',decode(wait_class,'User I/O',1,0),0)) "WAITING" ,
     sum(decode(session_state,'WAITING',decode(wait_class,'User I/O',1,0),0)) "IO" ,
     sum(decode(session_state,'WAITING',1,1)) "TOTAL"
from v$active_session_history 
where session_type='FOREGROUND'
group by session_id,session_serial#,module,action,program
order by sum(decode(session_state,'WAITING',1,1)) desc)
where rownum <11

You can restrict period of time analyzed by filtering with the sample_time column.